
Your online identity is shaped by the information about you on the web – both the content you make available and the content that others create about you. While you can’t completely control what others post about you, you can proactively curate and manage your online scholarly identity.
Curate your scholarly identity
Your scholarly identity includes information about you such as your:
- Training
- Areas of expertise
- Publications
- Funding
- Research agenda
- Reputation
- Contact information
Types of information you should control/manage:
- Names you publish under or are known by professionally
- Identifier numbers
- ORCID iD
- Other Identifiers (Scopus Author ID, Web of Science ResearcherID, etc.)
- Digital photo/representational image
- Email address (that you check often)
- Personal website address (if you have one)
- List of publications/presentations with DOIs
- PDF copies of publications/presentations (if the publication contracts allow sharing them; author manuscript versions otherwise)
The benefits of managing your scholarly identity include:
- Providing accurate information about yourself
- Connecting with other researchers
- Disseminating academic activities
- Sharing/exchanging materials with other researchers
- Facilitating tenure/promotion
- Reducing false or misleading information in search results
Learn more about managing your identity and maximizing your impact.
Explore types of impact
Bibliometrics are statistics used to measure the impact of authors, articles, and publications. They are often looked at for promotion, tenure, and grant funding. Learn more about ways to measure:
Citation analysis
Citation counts measure the impact of an author by counting the number of times they are cited in another work. There are different ways to calculate this.
h-index
The h-index measures both the productivity (number of articles published) and the impact (number of citations received) of a researcher or scholar. The h-index indicates the number of publications n that were cited at least n times. The index can also be applied to the productivity and impact of a scholarly journal as well as a group of scientists, such as a department or university.
If you have published 5 articles and each article has been cited at least 5 times, your h-index is 5.
Like most bibliometrics, the h-index is discipline specific, and average h-indexes vary widely from one subject area to another. Comparisons should not be made across disciplines or subject areas. The h-index also discriminates against early career researchers who have not yet published as many articles or whose articles have not yet been available long enough to have been read and cited by others.
Bibliometric databases that count citations include Web of Science, Scopus, Google Scholar, and some subject specific databases such as MathSciNet and SciFinder. It is important to note that these databases index different lists of journals, thus their derived h-indexes may vary. Citations in sources (journals, books, newspapers, etc.) not indexed by WOS, Scopus, or Google Scholar are not counted towards an author’s h-index.
g-index
The g-index is a variant of the h-index, which takes into account the citation evolution of the most cited papers over time. It can be determined by listing publications in decreasing order of number of citations. The g-index is the unique largest number such that the top g articles together received at least g squared citations. A g index of 5 indicates that the top 5 papers have a cumulative citation total of 25. A g-index of 6 would mean that your top 6 publications have been cited 36 times.
m-quotient
The m-quotient is another variation of the h-index; it aims at weighing the period of academic endeavor so that even junior scientists attain the importance that they deserve. The m-quotient is derived by dividing the h-index by the number of years since the first publication.
i10-index
The i10-index is a Google Scholar metric. It indicates the number of academic publications an author has written that have been cited by at least ten sources.
Other tools you can use to share your work and promote your researcher impact:
- Kudos
- Cloud-based platform that helps you to increase engagement with and impact of your research
- Impactstory
- Open-source website that helps researchers explore and share the online impact of their research
- Publish or Perish
- Software program that retrieves and analyzes academic citations
- PLoS Article Level Metrics
- Authors of PLoS articles can get citation, usage, and social media data
Additional measures
The following factors provide additional evidence of research impact and might be relevant for competitive grant applications and academic promotions:
- Conference publications
- International engagement
- Influence on industry, government, public policy, community, and cultural organizations
- Successfully completed research grants and projects
- Awards and prizes
- Holdings in libraries
- Partnerships, editorships, and research fellowships
- Membership in a learned academy
- Membership in a statutory committee
- Patents
- Research commercialization income
- Tangible community or societal benefits
Knowing the impact and importance of a journal can help you decide where to submit your articles. With bibliometric databases you can compare and evaluate journals, see the most productive research areas, download data, follow journals, and create robust data visualizations.
Journal Impact Factor (JIF) is one way to consider the relative stature of a publication venue. The JIF is a measure of how often the journal is cited; it is not a reflection of the stature of an individual author or article.
Journal Impact Factor is calculated by dividing the number of citations (in the current year) to articles published during the last two years by the number of articles published in the journal during those two years. The quotient is the JIF for a particular year.
The most established source for journal rankings is Journal Citation Reports (JCR), which is only available through a subscription. Alternatives to JCR include other indexers such as Scopus and Google Scholar. Alternative metrics that can be used to measure the relative importance of a journal include the h-5 index, SCImago Journal and Country Rank, and the Eigenfactor Score. More information about journal metrics and Scopus is available from our Scopus resource guide and Scopus Metrics training module.
While the JIF can help you to identify the most widely cited journals in a discipline, there are several limitations to this metric :
- Journal metrics vary among disciplines
- Journal metrics do not consider the nature of the citation (positive or negative)
- JIFs can change from year to year
- Some metrics can exclude smaller, niche journals.
Journal Citation Reports (JCR)
JCR uses the Journal Impact Factor to rank the importance of a journal by calculating the times its articles are cited. It is calculated by the total number of publications in a journal and the total number of citations to those publications over a two-year period. For example, a journal that had 100 publications in two years and received 5,000 citations the following year would have an impact factor of 50. JCR bases its calculations on Web of Knowledge data and can be accessed through Web of Science or Journal Citation Reports.
JCR covers over 11,000 scholarly and technical journals and conference proceedings from more than 3,000 publishers in science, social sciences, arts, and humanities.
SCImago Journal and Country Rank (SJR)
SCImago is a free online portal based on citation data tracked in Elsevier’s Scopus database. The ranking system incorporates citation data as well as relationships among journals (via citations). The SJR algorithm weights citations from journals according to how highly cited the journal itself is, which differs from the JCR (Journal Citation Reports) which weights all articles identically, regardless of their source.
The SJR (SCImago Journal Rank) indicator expresses the average number of weighted citations received in the selected year by the documents published in the selected journal in the three previous years: i.e., weighted citations received in year X (2019) to documents published in the journal in years X-1 (2018), X-2 (2017), and X-3 (2016).
Journals can be compared or analyzed separately. Country rankings may also be compared or analyzed separately. Journals can be grouped by subject area, subject category, or by country. Citation data is drawn from over 34,100 titles from more than 5,000 international publishers and country performance metrics from 239 countries worldwide.
SNIP (Source Normalized Impact per Paper)
Source Normalized Impact per Paper (SNIP) measures contextual citation impact by weighting citations based on the total number of citations in a subject field. The impact of a single citation is given higher value in subject areas where citations are less likely, and vice versa. Unlike the journal impact factor, SNIP corrects for differences in citation practices between scientific fields, thereby allowing for more accurate between-field comparisons of citation impact.
SNIP was created by Professor Henk F. Moed at Centre for Science and Technology Studies (CWTS), University of Leiden. SNIP values are available from CWTS Journal Indicators or in the Scopus database.
CWTS Journal Indicators currently provides four indicators:
- P. The number of publications of a source in the past three years.
- IPP. The impact per publication, calculated as the number of citations given in the present year to publications in the past three years divided by the total number of publications in the past three years. IPP is fairly similar to the well-known journal impact factor. Like the journal impact factor, IPP does not correct for differences in citation practices between scientific fields. IPP was previously known as RIP (raw impact per publication).
- SNIP. The source normalized impact per publication, calculated as the number of citations given in the present year to publications in the past three years divided by the total number of publications in the past three years. The difference with IPP is that in the case of SNIP citations are normalized in order to correct for differences in citation practices between scientific fields. Essentially, the longer the reference list of a citing publication, the lower the value of a citation originating from that publication.
- % self cit. The percentage of self citations of a source, calculated as the percentage of all citations given in the present year to publications in the past three years that originate from the source itself.
For more details, see: https://www.journalindicators.com/methodology
Eigenfactor Score
A journal's Eigenfactor score is a measure of the journal's total importance to the scientific community. Eigenfactor ranks the overall impact of a journal, and not the impact of articles within that journal. Eigenfactor scores are scaled so that the Eigenfactor scores of all journals listed in Clarivate's Journal Citation Reports (JCR) sum to 100. Thus, if a journal has an Eigenfactor score of 1.0, it has 1% of the total influence of all indexed publications. In 2013, the journal Nature has the highest Eigenfactor score, with a value of 1.603.
CiteScore
A journal's CiteScore is the total number of citations in a year to articles published in the four previous years, divided by the total number of articles published in those four years. CiteScore is limited to only to 5 peer-reviewed document types (articles, reviews, conference papers, data papers, and book chapters). CiteScore is similar to the Impact Factor but uses Scopus rather than Web of Science to gather its data and four years rather than two as the publication period.
Google Scholar Metrics
h5-index = The h5-index is the h-index for articles published in the last 5 complete years. It is the largest number h such that h articles published in 2015-2019 have at least h citations each. So, a publication that had 5 articles but only three had at least 5 citations or more would have an h5 of 3.
h5-median = The h5-median for a publication is the median number of citations for the articles that make up its h5-index.
Article-level metrics look at the impact of an article separate from the impact of the journal in which it is published. It looks both at traditional metrics such as number of citations or page views as well as altmetrics measures such as social media mentions.
What are altmetrics?
Altmetrics, or alternative metrics, go beyond the traditional means of measuring the impact of scholarly works via citations by analyzing mentions in social media, blogs, news outlets, and more. Unlike traditional metrics that can take years to show impact, altmetrics allow for more immediate analysis of impact.
Although altmetrics are often thought of as metrics about articles, they can be applied to journals, books, data sets, presentations, videos, source code repositories, web pages, etc. Altmetrics use public APIs across platforms to gather data with open scripts and algorithms. Altmetrics calculate scholar impact based on signs of impact such as usage (downloads, clicks, patents, syllabi, etc.), captures (bookmarks, favorites), mentions (new articles, blog posts, Wikipedia references), and social media (Tweets, shares, likes, comments). They demonstrate both the impact and the detailed composition of the impact.
Altmetrics should be used to complement traditional metrics and not used alone. When using altmetrics, exercise caution as sharing does not equal quality or include context. For example, an article could be shared due to its poor or biased research. Altmetrics often focus on what is popular at the moment; historically seminal works may be missed. Additionally, altmetrics can be abused by individuals who want to artificially increase their scores.
Altmetrics tools
Plum Analytics
PlumX Metrics provide insights into the ways people interact with research. Metrics are displayed using the PlumX Wheel which places activity into five categories: Usage, Captures, Mentions, Social Media, and Citations. Hovering on any PlumX WHeel provides detailed information on each of these categories. The example below indicates that most activity has occurred in the category of Usage followed by Social Media. PlumX Metrics are available on many library databases including EBSCO products and Elsevier products including Scopus.
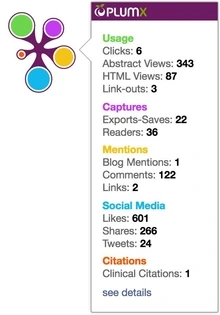
Figure caption: Plum Print showing various areas of impact
Altmetric
Altmetric provides an Altmetric Attention Score that measures how much and the types of attention a work has received using a graphic “donut.” The Attention Score is a weighted score that looks at volume, source, and author. A mention in a newspaper will receive more weight than a tweet. Each color in the Altmetric donut represents a different source of attention. For example, red indicates mentions in news sources and yellow indicates blog activity. In the example below, the research has received most mentions in news outlets. See the Altmetric Attention Score for more details on these numbers. Altmetric’s Bookmarklet for Researchers browser plug-in provides article-level metrics for any article you are currently reading.

Figure caption: Altmetric donut showing various areas of impact
Measuring the impact of books and book chapters is not as straightforward as it is for journals.
The following questions adapted from the Bernard Becker Medial Library are a good place to start:
- How many libraries hold the book in their collections? Use WorldCat to find out.
- Is the book noted on any bestseller lists?
- Is the book used as a textbook?
- Are chapters of the book incorporated into course syllabi?
- Are there any book reviews? If so, how many? Where are the book reviews published?
- Are there any discussions about the book in the Amazon Customer Discussion forum?
- Is the book available in an e-reader format as well as print?
- Has the book been mentioned in social media?
- What are the sales figures for the book?
- Has the book been included in bibliographies?
- Has the author been invited to present on the topic related to the book or book chapter?
- Has the author been invited to book signings?
- Are there subsequent editions of the book?
- Are there any translations of the book?
- Has the book been awarded any prizes?
- Has the book been noted by an organization as having made a significant contribution to a field?
Resources that help you answer these questions include:
Things to keep in mind
Metrics are only one of many indicators that may be used to determine research impact. Others indicators include:
- Publication counts
- Amount of research income
- Number of PhD students
- Size of research group
- Number of PI projects
- Number of patents and licenses obtained
- Real world impacts such as changes in public policy and legislation, economic benefits, or public health outcomes
Be aware of some caveats with these metrics:
- Citations and mentions do not necessarily indicate quality
- Metrics vary greatly from one discipline to another or even between sub-disciplines within a field
- Metrics will vary based upon the age and career length of a researcher
- Databases only gather data from the journals they index
- Bibliometrics and altmetrics can be manipulated by self-citations and buying likes and tweets
- Altmetrics can miss seminal papers